Image Details
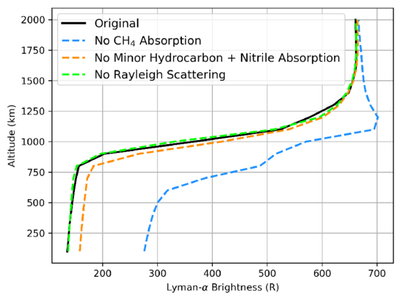
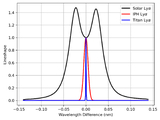
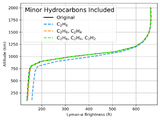
Caption: Figure 9.
1D Lyα signal profiles with CH4 absorption removed (blue dashed line), minor hydrocarbon and nitrile absorption removed (orange dashed line), and CH4 and N2 Rayleigh scattering removed (light green dashed line). These profiles are compared with the original Lyα brightnesses (black line), which include all forms of extinction.
Other Images in This Article
Show More
Copyright and Terms & Conditions
© 2026. The Author(s). Published by the American Astronomical Society.
Copyright ©
2026 Astronomy Image Explorer. All Rights Reserved.