Image Details
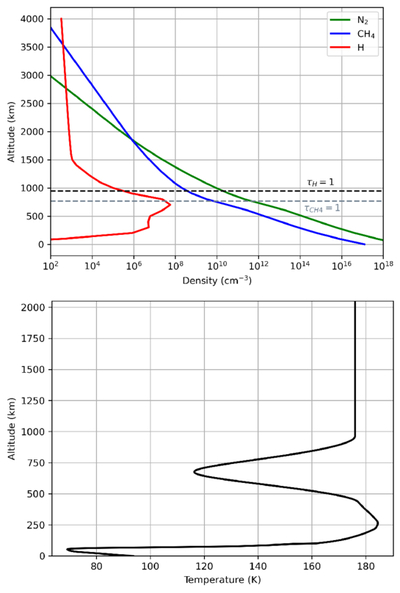
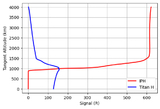
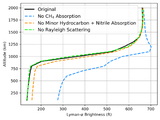
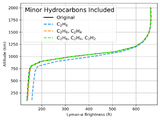
Caption: Figure 5.
Top panel: N2, CH4, and H densities we supply as inputs to the 1D model. Above the exobase, the H densities follow a Chamberlain model profile (J. W. Chamberlain 1963). The black dashed line marks the altitude at which the vertical optical depth from H scattering at Lyα line center reaches unity. The gray dashed line marks the altitude at which the vertical optical depth from CH4 absorption at Lyα line center reaches unity. Bottom panel: 1D model temperature profile.
Other Images in This Article
Show More
Copyright and Terms & Conditions
© 2026. The Author(s). Published by the American Astronomical Society.
Copyright ©
2026 Astronomy Image Explorer. All Rights Reserved.