Image Details
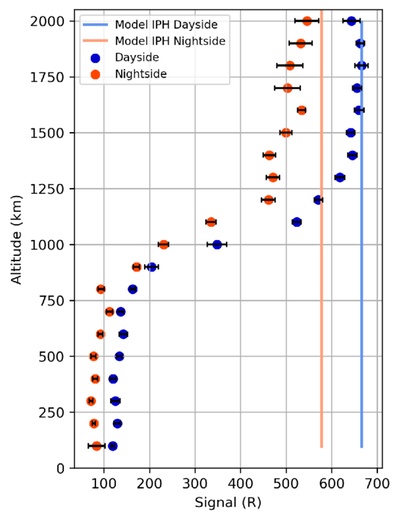
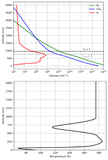
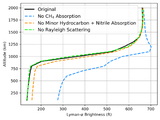
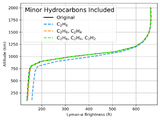
Caption: Figure 3.
Model IPH emissions (solid lines) and Lyα brightnesses measured by UVIS (scatter points) for the dayside and nightside bins, centered at the equator, during the T10 flyby (2006 January 15). These observations occurred during solar cycle 23. The model IPH emissions are scaled to the solar activity at the time of the observation, while the UVIS-measured brightnesses are multiplied by a constant correction factor of 1.116 (see text). Note that the nightside emissions are produced by scattered IPH photons.
Other Images in This Article
Show More
Copyright and Terms & Conditions
© 2026. The Author(s). Published by the American Astronomical Society.
Copyright ©
2026 Astronomy Image Explorer. All Rights Reserved.