Image Details
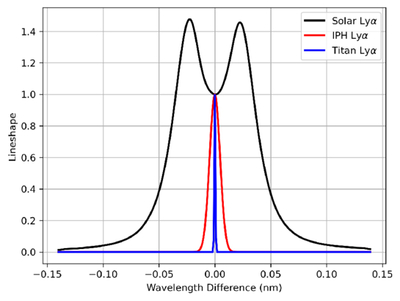
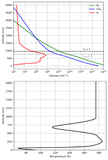
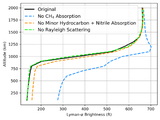
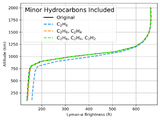
Caption: Figure 4.
The black line shows the lineshape of the solar Lyα flux at a heliocentric distance of 1 au, normalized to unity at line center, during the T10 flyby. The red line shows the Voigt profile of IPH Lyα at a temperature of 16,000 K. The blue line shows the Voigt profile of Lyα in Titan’s upper atmosphere for a temperature of 150 K. The wavelength differences on the x-axis are relative to Lyα line center.
Other Images in This Article
Show More
Copyright and Terms & Conditions
© 2026. The Author(s). Published by the American Astronomical Society.
Copyright ©
2026 Astronomy Image Explorer. All Rights Reserved.