Image Details
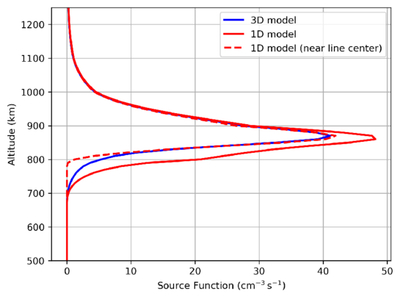
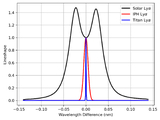
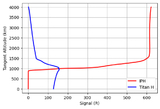
Caption: Figure 11.
Wavelength-integrated Lyα source functions with respect to altitude for the 1D (red lines) and 3D (blue line) models. The red dashed line represents source functions integrated within 0.008 Å of Lyα line center, while the red solid line represents source functions integrated over the entire wavelength range. Both source functions correspond to a 0° solar zenith angle.
Other Images in This Article
Show More
Copyright and Terms & Conditions
© 2026. The Author(s). Published by the American Astronomical Society.
Copyright ©
2026 Astronomy Image Explorer. All Rights Reserved.