Image Details
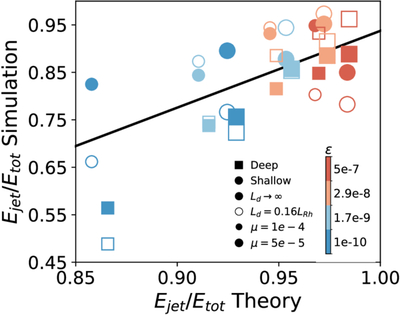
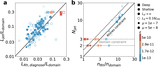
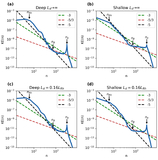
Caption: Figure 9.
The smoothness of the jets. The jet energy fraction (Ejet/Etot) diagnosed in the simulations is compared with predictions from Equation (3). Results are shown for the equilibrium state simulations with higher energy injection rates and damping rates (ε = 5 × 10⁻⁷, 2.9 × 10⁻⁸, 1.7 × 10⁻⁹, and 10−10; μ = 5 × 10⁻⁵ and 10−4), as simulations with lower injection and damping rates have not reached full equilibrium. The black line represents a linear fit.
Other Images in This Article
Show More
Copyright and Terms & Conditions
© 2026. The Author(s). Published by the American Astronomical Society.
Copyright ©
2026 Astronomy Image Explorer. All Rights Reserved.