Image Details
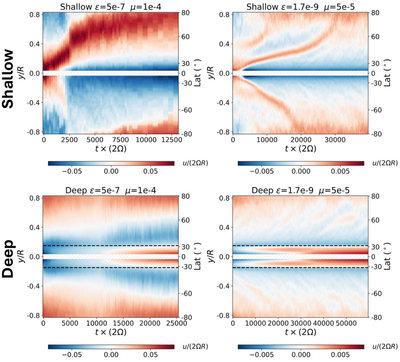
Caption: Figure 5.
Sensitivity to initial conditions. Evolution of the zonal-mean zonal velocity for simulations initialized with reversed jets (see text for details). The horizontal axis represents the simulation time, and the vertical axis represents latitude. The hatched region near the equator marks the latitudes that are not included in the model domain, and the black dashed lines indicate the TC latitude in the deep cases.
Other Images in This Article
Show More
Copyright and Terms & Conditions
© 2026. The Author(s). Published by the American Astronomical Society.
Copyright ©
2026 Astronomy Image Explorer. All Rights Reserved.