Image Details
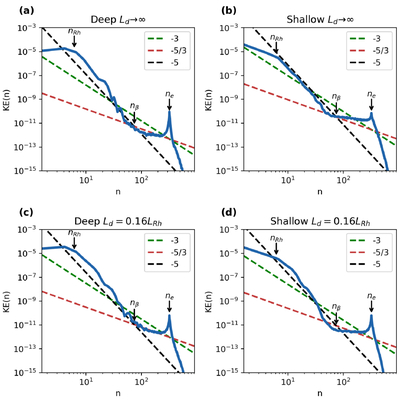
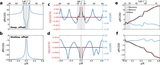
Caption: Figure 8.
KE spectrum. Snapshots of the KE (u2/2 + v2/2) spectra from simulations with ε = 2.9 × 10⁻¹¹ and μ = 10−7. The blue line shows the simulated KE spectrum. The green, red, and black dashed lines indicate the theoretical slopes of −3, −5/3, and −5, respectively. The transition wavenumbers ne, nβ, and nRh are also marked, where nβ and nRh are estimated using the averaged β across the domain.
Other Images in This Article
Show More
Copyright and Terms & Conditions
© 2026. The Author(s). Published by the American Astronomical Society.
Copyright ©
2026 Astronomy Image Explorer. All Rights Reserved.