Image Details
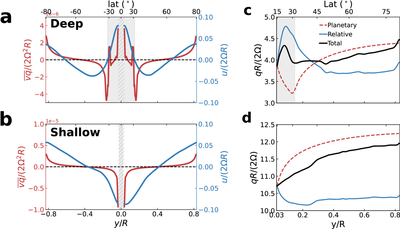
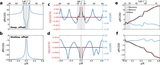
Caption: Figure 4.
Examination of different jet formation mechanisms. Panels (a) and (b) show the zonal-mean nondimensionlized eddy momentum flux convergence (﹩\overline{vq}/(2{{\rm{\Omega }}}^{2}R)﹩, red lines) calculated from the deep and shallow β profiles based on SSST and zonal jet speed (u/(2ΩR), blue lines) profiles as a function of latitude in the simulation with Ld → ∞, ε = 5 × 10⁻¹⁰, and α = 10−7. Panels (c) and (d) show the nondimensionalized zonal-mean PV profile (qR/(2Ω)) in the northern hemisphere for the same simulations in (a) and (b) respectively, where the red line denotes the planetary PV (﹩\overline{{q}_{p}}=\int \beta dy=-2{\rm{\Omega }}\mathrm{ln}H﹩), the blue line denotes the jet-induced relative PV (﹩\overline{{q}_{r}}=-\partial \overline{u}/\partial y-\overline{\psi }/{L}_{d}^{2}﹩), and the black line denotes the total PV (﹩\overline{q}=\overline{{q}_{p}}+\overline{{q}_{r}}﹩), where an overline denotes a zonal average. A constant offset (equal to ﹩{\overline{q}}_{p}﹩ at the equator) is added to ﹩{\overline{q}}_{r}﹩ for better comparison.
Other Images in This Article
Show More
Copyright and Terms & Conditions
© 2026. The Author(s). Published by the American Astronomical Society.