Image Details
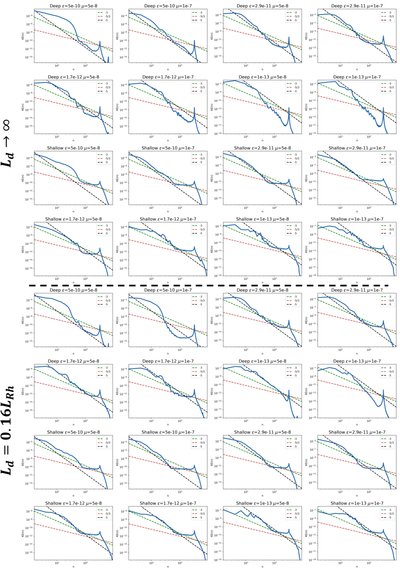
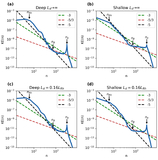
Caption: Figure 13.
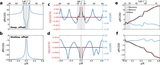
KE spectra. Snapshots of the KE (u2/2 + v2/2) spectra in all simulations. The blue line shows the simulated KE spectrum. The green, red, and black dashed lines indicate the theoretical slopes of −3, −5/3, and −5, respectively. The transition wavenumbers ne and nβ are indicated by the intersections of the green and red lines, and the red and black lines, respectively.
Other Images in This Article
Show More
Copyright and Terms & Conditions
© 2026. The Author(s). Published by the American Astronomical Society.
Copyright ©
2026 Astronomy Image Explorer. All Rights Reserved.