Image Details
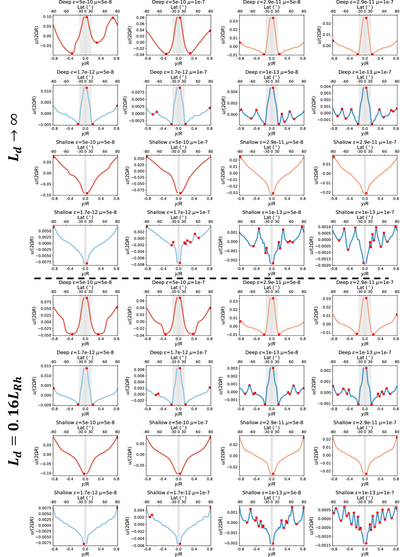
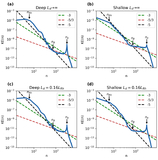
Caption: Figure 12.
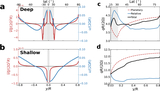
Zonal-mean jet profiles. Lines represent the zonal-mean zonal velocity ﹩\overline{u}﹩ from the simulations. Red dots indicate the diagnosed jet peaks, as defined in Appendix D. Gray shading indicates regions outside the TC, and the gray hatched regions mark the area excluded from our simulation domain. Note that the lowest latitudes in the northern and southern hemispheres (±15∘) are connected as a single point in our simulation.
Other Images in This Article
Show More
Copyright and Terms & Conditions
© 2026. The Author(s). Published by the American Astronomical Society.
Copyright ©
2026 Astronomy Image Explorer. All Rights Reserved.