Image Details
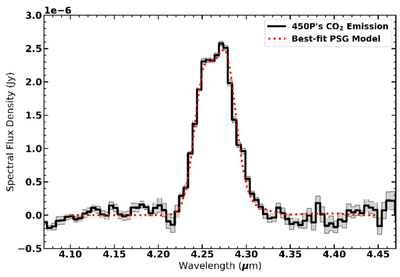
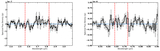
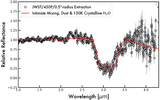
Caption: Figure 7.
A close-up of the continuum-subtracted JWST spectrum of 450P centered on the CO2 emission band (black line) with the best-fit model spectrum of the CO2ν3 fluorescence emission band overplotted in a red dashed line using the Planetary Spectrum Generator. The model is consistent with QCO2 = (6.99 ± 0.07) × 1024 molecules s−1 and Trot = 60 ± 1 K. The associated 1σ uncertainties for the spectrum are shown with the gray shaded regions.
Other Images in This Article
Copyright and Terms & Conditions
© 2026. The Author(s). Published by the American Astronomical Society.
Copyright ©
2026 Astronomy Image Explorer. All Rights Reserved.