Image Details
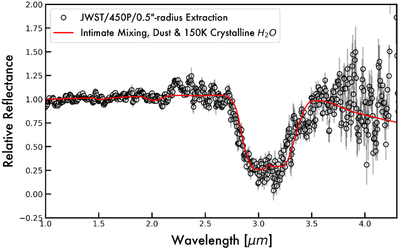
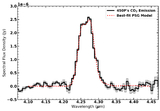
Caption: Figure 9.
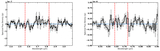
The reflectance spectrum of 450P (black open circles with gray 1σ error bars) is compared with the maximum likelihood spectral model (red curve), which assumes intimately mixed grains of amorphous carbon and crystalline water ice. This model is not very sensitive to ice temperatures, so while it assumes Tice = 150 K, ice temperatures within several tens of kelvin fit the data similarly well.
Other Images in This Article
Copyright and Terms & Conditions
© 2026. The Author(s). Published by the American Astronomical Society.
Copyright ©
2026 Astronomy Image Explorer. All Rights Reserved.