Image Details
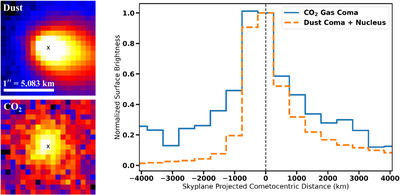
Caption: Figure 6.
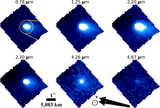
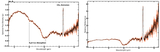
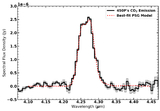
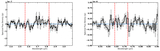
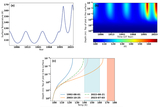
Measurements of the dust and CO2 gas emission in 450P’s coma. The left two panels display the dust and CO2 gas surface brightness maps. The location of 450P’s nucleus is indicated by the cross in each image, and the panel orientations and sky-plane velocity vector directions are the same as in Figure 4. A scale bar is included in the dust image. The dust image shows elongated structure with a tail, while the CO2 is much more symmetric. The right panel displays radial surface brightness profiles for CO2 (solid blue line) and dust (dashed orange line) plotted against projected cometocentric distance (sunward corresponds to negative values, and antisunward/tailward corresponds to positive values of the abscissa). Each radial profile is normalized to 1 in the central pixel, and the dust profile also includes the nucleus’s contribution. For reference, the peak values of each profile before normalization are 227.95 MJy sr−1 for the nucleus + dust and 3.57 MJy sr−1 for the CO2 profiles.
Other Images in This Article
Copyright and Terms & Conditions
© 2026. The Author(s). Published by the American Astronomical Society.