Image Details
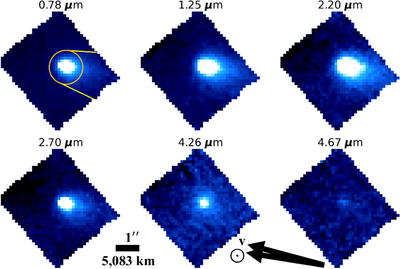
Caption: Figure 4.
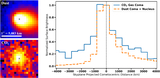
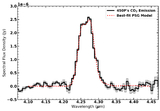
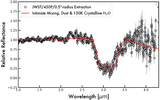
Wavelength-integrated image panels of 450P extracted from the JWST NIRSpec IFU datacube at different bandpasses (the effective wavelength is listed directly above each panel). The panels use the same color scale, ranging from black through blue to white, to indicate increasing surface brightness. The panels are shown with J2000 equatorial north up and east to the left; the sky-plane-projected directions of the Sun and 450P’s velocity vectors are indicated by black arrows. The image scale bar is the same for each panel. A faint surface brightness enhancement is seen extending toward the west–southwest of each panel, which is consistent with a coma and tail formation indicated in the top left panel by an orange circle and yellow lines, respectively. Although the bottom left panel’s bandpass includes the H2O emission band at 2.70 μm and the bottom right panel includes the 4.67 μm band of CO, no emission feature was detected for either in the extracted spectrum (see Figure 5), and thus the observed surface brightness at these wavelengths is dominated by reflected flux from the nucleus and dust in the coma. The image at 4.26 μm contains contributions from both dust and a prominent CO2 emission feature that dominates the coma morphology and appears more circular than the coma at other wavelengths that are dominated by dust continuum.
Other Images in This Article
Copyright and Terms & Conditions
© 2026. The Author(s). Published by the American Astronomical Society.