Image Details
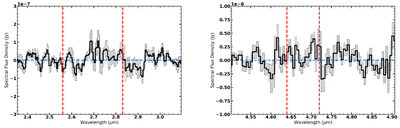
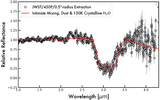
Caption: Figure 8.
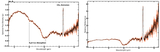
The continuum-subtracted JWST spectrum (black line) for the spectral ranges where H2O (left panel) and CO (right panel) emission bands would appear if present. The 1σ spectrum uncertainties are shown in gray, and the two red vertical dashed lines show the expected wavelength region of each emission band. Upper limits to H2O and CO production rates were calculated using integrated flux measurements between the dotted red vertical lines (see Section 4.4).
Other Images in This Article
Copyright and Terms & Conditions
© 2026. The Author(s). Published by the American Astronomical Society.
Copyright ©
2026 Astronomy Image Explorer. All Rights Reserved.