Image Details
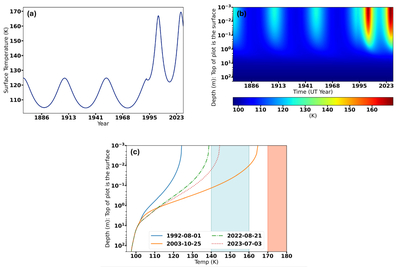
Caption: Figure 11.
The time evolution of the (a) subsolar surface temperature, (b) radial profile of nucleus’s interior temperature, and (c) selected nucleus interior radial temperature profiles for dates when dust production estimates are available. The thermal effects due to the a-jump in 1992 are easily seen by the increased temperatures that occurred shortly afterward. In panel (c), the cyan shaded region between temperatures [140, 160 K] represents temperatures where crystallization of AWI occurs efficiently and with it the possibility for the release of trapped CO2. The light-red shaded region displays temperatures where the sublimation of crystalline water ice begins to dominate.
Other Images in This Article
Copyright and Terms & Conditions
© 2026. The Author(s). Published by the American Astronomical Society.