Image Details
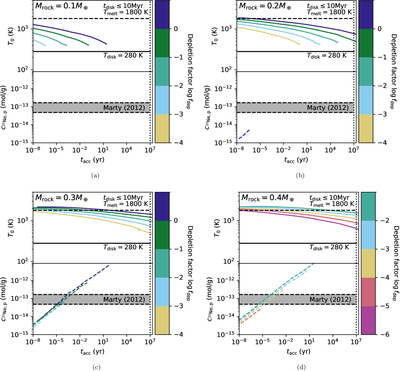
Caption: Figure 4.
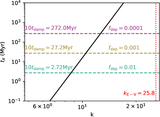
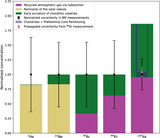
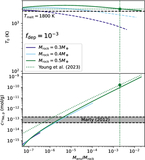
Dissolution calculation of the concentration of primordial 22Ne captured at the molten surface of magma oceans on Earth embryos embedded in the solar nebula. Subfigures (a), (b), (c), and (d) present our results for protocore masses of 0.1, 0.2, 0.3, and 0.4 M⊕, respectively. For each case, the upper panel shows the temperature T0 of the envelope–mantle boundary as a function of gas accretion time tacc and the lower panel the resulting concentration of primordial 22Ne dissolved in the silicate interior ﹩{c}_{{}^{22}{\rm{Ne}},{\rm{p}}}﹩ before the mantle solidifies at a melting temperature Tmelt ≈ 1800 K. The shaded areas represent the target concentration required to explain the present-day budget of the deep mantle, as constrained by B. Marty (2012) and corrected by a factor of ≈18.7 to account for mantle outgassing (R. Parai 2022). The solid black line indicates the temperature Tdisk of the MMSN of C. Hayashi (1981) and the black dashed line the melting temperature Tmelt of the basaltic mantle (Section 3.2) required at the surface for the dissolution of primordial gas in the interior. The upper bound on the lifetime of the disk (E. E. Mamajek 2009) is indicated with a dotted vertical line, corresponding to the maximal possible time after which primordial accretion must come to an end. Different colors account for different depletion factors fdep ≤ 1 of the gas density of the MMSN disk.
Other Images in This Article
Copyright and Terms & Conditions
© 2026. The Author(s). Published by the American Astronomical Society.