Image Details
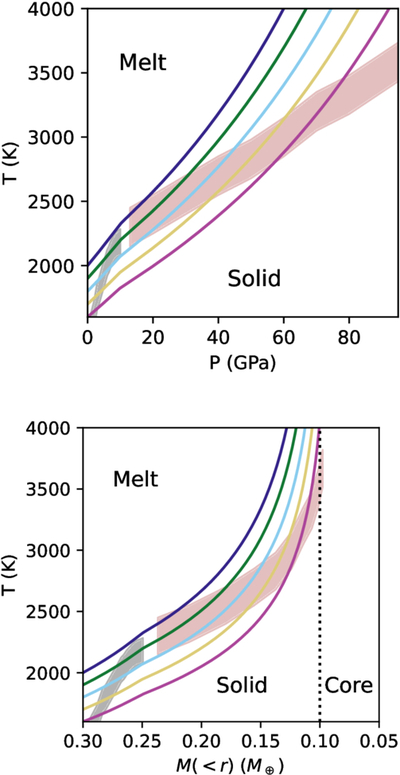
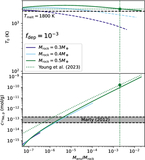
Caption: Figure 3.
Adiabatic thermal profiles of the silicate interior of Mrock = 0.3 M⊕ Earth embryos compared to mantle solidus curves. Upper panel: temperature T versus pressure P profiles (solid curves) for surface temperatures of [1600, 1700, 1800, 1900, 2000]K in magenta, yellow, cyan, green, and blue, respectively. The profiles are compared with constraints on the solidus point of peridotite for P ≤ 10 GPa (M. M. Hirschmann 2000) and of a chondritic Earth-like deep mantle for P > 12 GPa (D. Andrault et al. 2011) displayed with shaded black and red areas, respectively. Lower panel: the same as the upper panel, but the temperature profiles are now shown as functions of the cumulative enclosed mass M( < r) of the rocky interior of embryos. The solidus pressures have been converted to mass by interpolation of the hydrostatic P − m profiles. The dotted vertical line indicates the delimitation between the silicate mantle and the metal core, which is assumed to account for 32.5% of the total mass following an Earth-like structure (O. Sorokhtin et al. 2011).
Other Images in This Article

Copyright and Terms & Conditions
© 2026. The Author(s). Published by the American Astronomical Society.