Image Details
Caption: Figure 5.
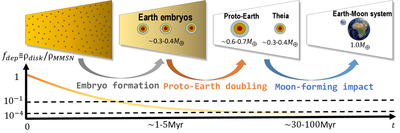
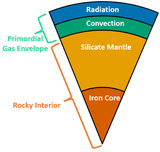
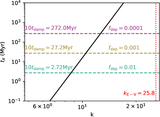
Schematic illustration of the favored Earth formation scenario implied by our results. Top: from left to right, we show the different formation stages of the Earth from a side view of a truncated solar nebula, which is initially rich in gas (yellow) and dust (gray dots). As the disk progressively dissipates, the coagulation of solids (see Section 4.1.1) leads to the formation of a set of three ∼0.3−0.4 M⊕ embryos, displayed with cyan, orange, and red circles, representing the layered embryo structure of Figure 1. Following the dispersal of the disk, embryo mergers are enabled, resulting in the formation of the proto-Earth via the doubling (orange arrow) of two ∼0.3−0.4 M⊕ embryos. The proto-Earth later collides (blue arrow) with the remaining embryo (i.e., Theia) to form the final Earth–Moon system. Bottom: time evolution (yellow curve) of the volume gas density ρdisk of the solar nebula beginning from a full MMSN density ﹩{\rho }_{{\rm{MMSN}}}﹩, as parametrized by the parameter fdep of Equation (8). Key values of fdep = 10−1 and fdep = 10−4 setting the boundaries between the gas-rich, gas-poor, and dispersed stages of the disk are shown with dashed horizontal lines.
Other Images in This Article
Copyright and Terms & Conditions
© 2026. The Author(s). Published by the American Astronomical Society.