Image Details
Caption: Figure A1.
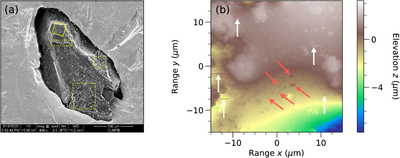
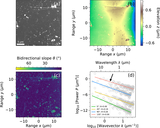
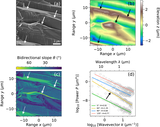
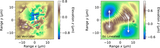
(a) SEM image of a CE-6 lunar grain, which shows a region (solid square, ROI No. 35 in Table A1) that was measured by AFM and other regions (dashed rectangles) that cannot be measured. (b) Surface elevations of a lunar grain contaminated by the tip of the AFM, where repetitive mounds (red arrows) and horizontal scan lines (white arrows) are shown.
Other Images in This Article
Show More
Copyright and Terms & Conditions
© 2026. The Author(s). Published by the American Astronomical Society.
Copyright ©
2026 Astronomy Image Explorer. All Rights Reserved.