Image Details
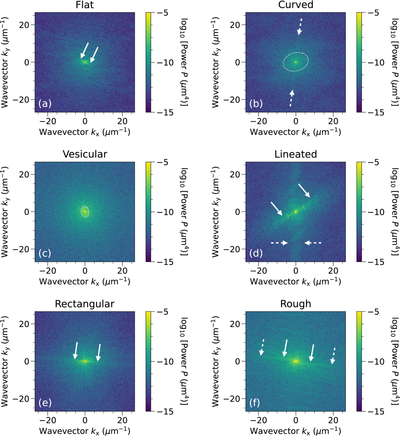
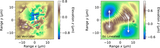
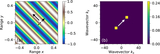
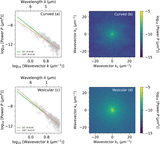
Caption: Figure 3.
2D power spectral densities of the six representative ROIs shown in Figures 1–2. In panels (a) and (d)–(f), the dominant directionality is pointed by solid arrows. In panels (b), (d), and (f), the weaker directionality is denoted by dashed arrows. In panels (b) and (c), the weak directionality is also marked by dashed ellipses, which were outlined along powers around −11 and −7.8, respectively. For clarification, the power spectra of panels (b) and (c) without any symbols overlaid are also shown in Figure A5.
Other Images in This Article
Show More
Copyright and Terms & Conditions
© 2026. The Author(s). Published by the American Astronomical Society.
Copyright ©
2026 Astronomy Image Explorer. All Rights Reserved.