Image Details
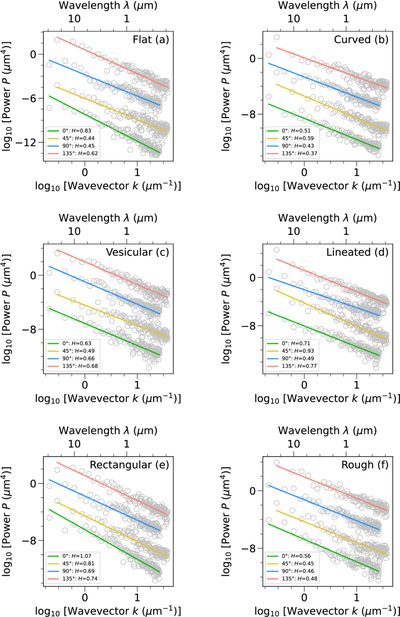
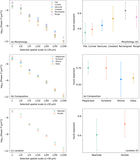
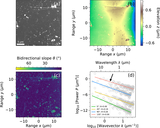
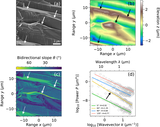
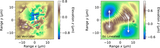
Caption: Figure 4.
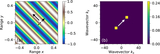
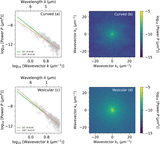
1D radial profiles (gray circles) of the power spectral densities of the six representative ROIs shown in Figures 1–3. The linear best fits and the resulting Hurst exponents are shown for those with azimuth angles of 0∘ (green), 45∘ (yellow), 90∘ (blue), and 135∘ (red). Note that the four radial profiles are shifted vertically for clarity.
Other Images in This Article
Show More
Copyright and Terms & Conditions
© 2026. The Author(s). Published by the American Astronomical Society.
Copyright ©
2026 Astronomy Image Explorer. All Rights Reserved.