Image Details
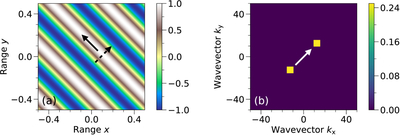
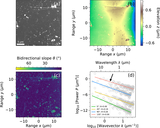
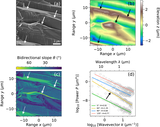
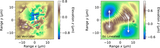
Caption: Figure A4.
(a) Sine wave with an expression of ﹩z=\sin \left(4\pi x+4\pi y\right)﹩ in the spatial domain and (b) its power spectral density (in absolute values) in the wavevector domain. In panel (a), the orientation of the peak values of the sine wave is indicated by the solid black arrow, and the direction exhibiting the largest variation in values is indicated by the dashed black arrow. In panel (b), the direction connecting the power impulses (yellow squares) is denoted by the white arrow.
Other Images in This Article
Show More
Copyright and Terms & Conditions
© 2026. The Author(s). Published by the American Astronomical Society.
Copyright ©
2026 Astronomy Image Explorer. All Rights Reserved.