Image Details
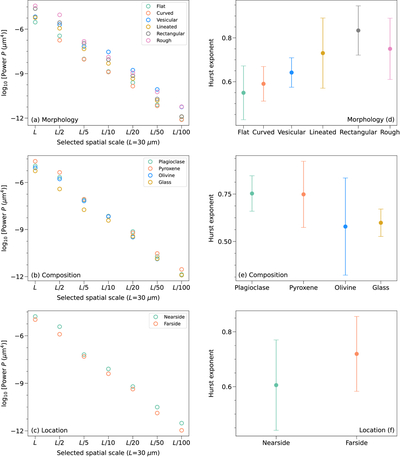
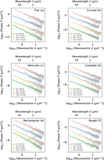
Caption: Figure 5.
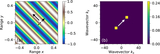
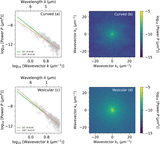
Power spectral densities (a)–(c) and Hurst exponents (d)–(f) of all the ROIs. In panels (a) and (d), the ROIs were classified based on their morphology. In panels (b) and (e), the ROIs were classified based on their compositions. In panels (c) and (f), the ROIs were classified based on their locations. In panels (a)–(c), the powers were selected at wavelengths of 1/100, 1/50, 1/20, 1/10, 1/5, 1/2, and 1 times the ROI length of 30 μm.
Other Images in This Article
Show More
Copyright and Terms & Conditions
© 2026. The Author(s). Published by the American Astronomical Society.
Copyright ©
2026 Astronomy Image Explorer. All Rights Reserved.