Image Details
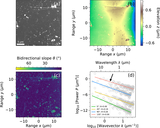
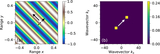
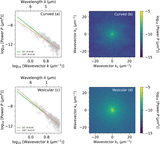
Caption: Figure 7.
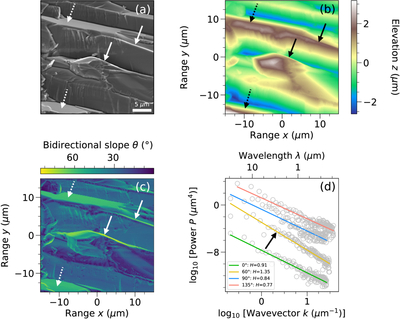
(a) SEM image, (b) surface elevations, (c) surface slopes, and (d) 1D radial profiles of power spectral densities of the ROI with the largest Hurst exponent in this study. As shown in panels (a)–(c), this ROI is a rectangular surface featured by linear ridges (solid arrows) and planar slopes >60∘ (dashed arrows; ROI No. 38 in Table A1). In panel (d), the black arrow points to the radial profile with the largest Hurst exponent.
Other Images in This Article
Show More
Copyright and Terms & Conditions
© 2026. The Author(s). Published by the American Astronomical Society.
Copyright ©
2026 Astronomy Image Explorer. All Rights Reserved.