Image Details
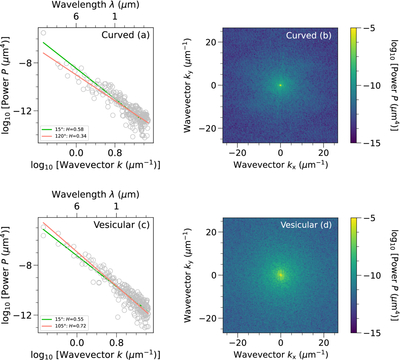
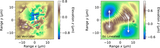
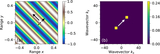
Caption: Figure A5.
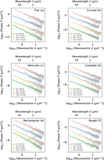
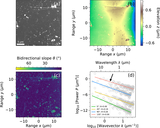
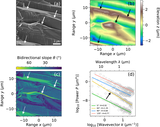
1D radial profiles ((a) and (c)) and 2D ((b) and (d)) matrices of the power spectral densities of the curved and vesicular ROIs shown in Figures 1–3. In panel (a), the 1D radial profiles with azimuth angles of 15∘ (green) and 120∘ (red) are shown. In panel (c), the 1D radial profiles with azimuth angles of 15∘ (green) and 105∘ (red) are shown.
Other Images in This Article
Show More
Copyright and Terms & Conditions
© 2026. The Author(s). Published by the American Astronomical Society.
Copyright ©
2026 Astronomy Image Explorer. All Rights Reserved.