Image Details
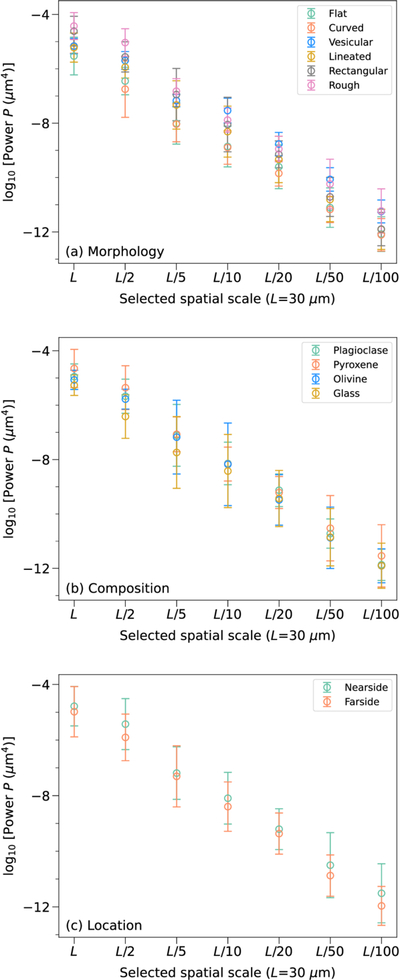
Caption: Figure A6.
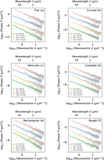
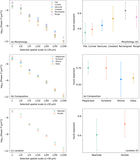
Power spectral densities grouped by (a) morphological, (b) compositional, and (c) location types with their 1σ deviations shown as error bars. These powers were selected at wavelengths of 1/100, 1/50, 1/20, 1/10, 1/5, 1/2, and 1 times the ROI length of 30 μm.
Other Images in This Article
Show More
Copyright and Terms & Conditions
© 2026. The Author(s). Published by the American Astronomical Society.
Copyright ©
2026 Astronomy Image Explorer. All Rights Reserved.