Image Details
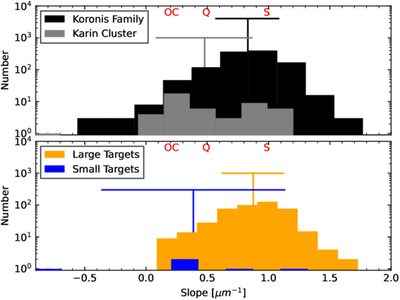
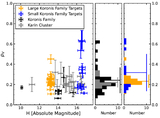
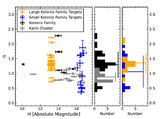
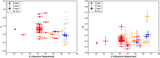
Caption: Figure 8.
Top: histogram of spectral slope for Koronis family members (black) and Karin cluster members (gray). Bottom: histogram of spectral slope for large Koronis family members (orange) and small Koronis family members (blue). Bus–DeMeo mean S- and Q-type spectral slopes and the upper-end slope of ordinary chondrites (P. Vernazza et al. 2006) are indicated in red. Weighted means and 1σ uncertainties for each population are shown in their respective colors. The Koronis family exhibits, on average, redder slopes than the younger Karin cluster, consistent with more advanced space weathering. Smaller Koronis family members appear less red and more Q-type–like, suggesting differences in surface properties such as regolith grain size or compaction. Sample sizes are limited, and additional spectral observations would help disentangle the effects of regolith evolution and space weathering.
Other Images in This Article
Show More
Copyright and Terms & Conditions
© 2026. The Author(s). Published by the American Astronomical Society.