Image Details
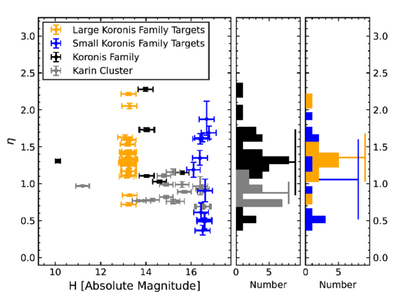
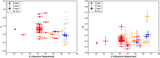
Caption: Figure 7.
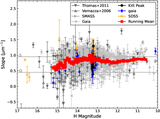
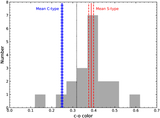
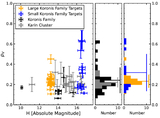
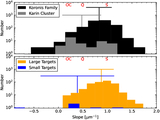
Corrected absolute magnitude (H; P. Pravec et al. 2012) vs. NEATM-derived beaming parameter (η) for the Koronis family (this work) and Karin cluster (A. W. Harris et al. 2009). In the left panel, large (13 < H < 14; orange; N = 23) and small (16 < H < 17; blue; N = 12) Koronis family members are shown along with remaining Koronis family targets (black; N = 42) that fell outside of the designated size populations and Karin cluster members (gray; N = 16). The middle panel shows histograms of η for all Spitzer Koronis family (black) and Karin cluster (gray) targets, with solid horizontal lines indicating mean values and vertical solid lines representing 1σ uncertainties. We find that the Karin cluster has a much tighter η distribution (η = 0.88 ± 0.14) that is much lower compared with the Koronis family targets (η = 1.29 ± 0.43), which cover a wide range from roughly η = 0.4 to 2.5. The right panel shows η histograms for large (orange) and small (blue) Koronis family targets, with solid horizontal lines indicating mean values and vertical solid lines representing 1σ uncertainties. The large and small subpopulations yield mean η values of η = 1.36 ± 0.32 and η = 1.06 ± 0.53, respectively, with full overlap within 1σ. However, a K-S test suggests no common underlying distribution (DK-S = 0.42, p = 0.08).
Other Images in This Article
Show More
Copyright and Terms & Conditions
© 2026. The Author(s). Published by the American Astronomical Society.