Image Details
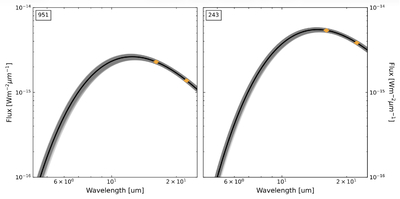
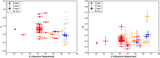
Caption: Figure 1.
Best-fit NEATM SED for the two ground-truth targets in this work: 951 Gaspra (left) and 243 Ida (right). The orange data points represent the measured Spitzer flux values with 1σ uncertainties in PUI-B and PUI-R. The solid black line represents the best-fit model, which shows excellent agreement with the measured data points. The gray lines represent all 2000 MC runs (a “spaghetti” plot) with a low transparency (2%) to visualize the model uncertainty. Darker regions correspond to higher density of overlapping runs and indicate the 1σ uncertainty envelope. At any wavelength, the spread of gray lines gives the uncertainty distribution. Due to limited SED sampling, uncertainty is largest at smaller wavelengths and smallest near the measured PUI-B and PUI-R points.
Other Images in This Article
Show More
Copyright and Terms & Conditions
© 2026. The Author(s). Published by the American Astronomical Society.