Image Details
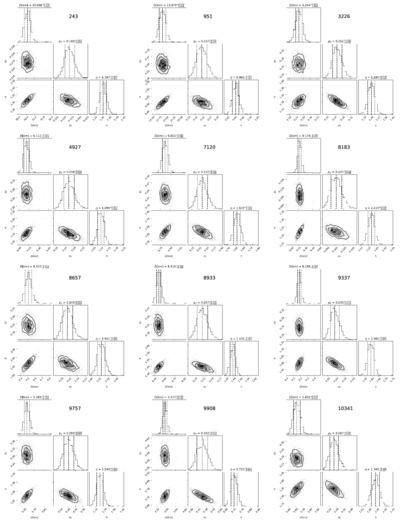
Caption: Figure 10.
Corner plot for the posterior probability distributions of NEATM-derived D, pV, and η for all 42 Koronis family targets and 951 Gaspra. We plot the retrieved median and the 16th and 84th percentile as dashed lines in every posterior plot histogram. The 16th and 84th percentiles are used as the upper and lower 1σ uncertainties for D, pV, and η in this work. Target IDs are listed in the upper right corner for each corner plot.
Other Images in This Article
Show More
Copyright and Terms & Conditions
© 2026. The Author(s). Published by the American Astronomical Society.
Copyright ©
2026 Astronomy Image Explorer. All Rights Reserved.