Image Details
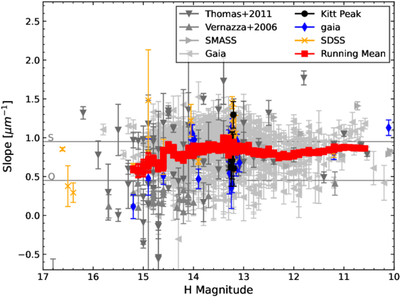
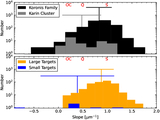
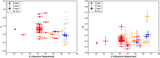
Caption: Figure 4.
Spectrophotometric slope vs. H-magnitude. Spectrophotometric slopes of Koronis family targets are shown in gray for C. A. Thomas et al. (2011) Kitt Peak targets, P. Vernazza et al. (2006) Karin cluster targets, SMASS visible to near-infrared Koronis family targets, and Gaia DR3 reflectance spectra of Koronis family targets. Those targets that appear in both our Spitzer dataset and C. A. Thomas et al. (2011) are plotted with black circles. Gaia and SDSS spectrophotometric slopes for targets in the Spitzer Koronis family dataset (this work; A. W. Harris et al. 2009) are shown as blue diamonds and orange crosses, respectively. The two parallel gray lines indicate the spectral slope values for the average S- and Q-type taxonomies calculated from the color indices presented in C. L. Dandy et al. (2003). The red squares show a running box mean (box size = 35) of all data points. The running box mean trend shows a steep slope from the small size limit of the observational sample until an average diameter of approximately 5 km is reached. Figure adapted from C. A. Thomas et al. (2011), Figure 2.
Other Images in This Article
Show More
Copyright and Terms & Conditions
© 2026. The Author(s). Published by the American Astronomical Society.