Image Details
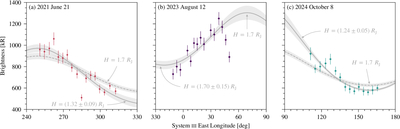
Caption: Figure 9.
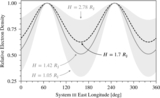
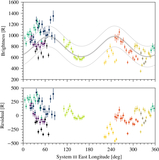
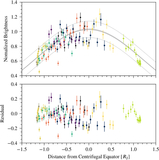
Electron density scale height fits to observations of Europa’s 630.0 nm [O I] auroral brightnesses assuming direct proportionality between electron density and emission brightness (Equation (2)). The points with error bars are the observed brightnesses and their individual random uncertainties. The solid gray line shows a fit of the expected change in brightness (density) at an orbital distance of 9.4 RJ as a function of System III east longitude allowing the scale height and amplitude to vary. The dashed gray line shows the same type of fit but with the scale height fixed to 1.7 RJ (F. Bagenal & P. A. Delamere 2011). In panel (b) these are the same, so we have only displayed the variable scale height fit. The shaded gray regions show the uncertainties in the fits and are affected only by random uncertainties in the individual measurements; therefore, they likely underestimate the total uncertainty on the scale height parameter.
Other Images in This Article
Copyright and Terms & Conditions
© 2026. The Author(s). Published by the American Astronomical Society.