Image Details
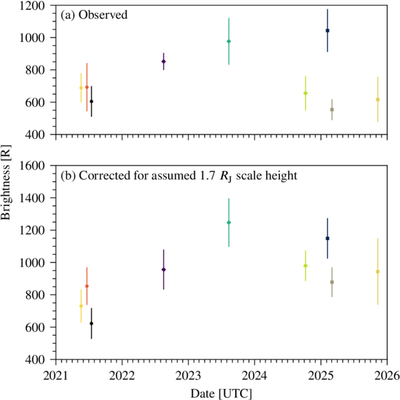
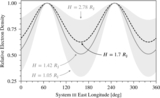
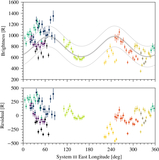
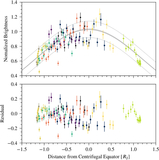
Caption: Figure 7.
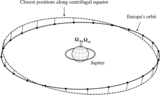
Weighted average nightly 630.0 nm [O I] brightness over the five years of observations (a) as observed and (b) after correcting for ambient plasma density with a scale height of 1.7 RJ (F. Bagenal & P. A. Delamere 2011). Error bars show the standard deviation in the weighted averages. Perceptually uniform colors and symbols (circles, diamonds, and squares) differentiate separate observing nights to allow the reader to evaluate the goodness of fit on a night-to-night basis (see the legend in Figure 2).
Other Images in This Article
Copyright and Terms & Conditions
© 2026. The Author(s). Published by the American Astronomical Society.
Copyright ©
2026 Astronomy Image Explorer. All Rights Reserved.