Image Details
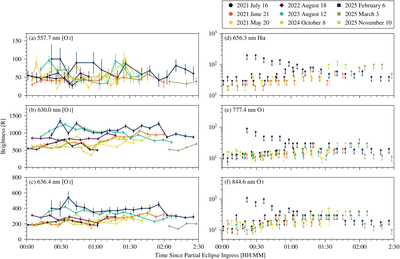
Caption: Figure 2.
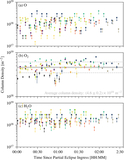
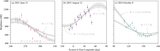
Calibrated auroral brightnesses for (a) 557.7 nm [O I], (b) 630.0 nm [O I], and (c) 636.4 nm [O I] and 1σ detectability thresholds for (d) 656.3 nm Hα, (e) 777.4 nm O I, and (f) 844.6 nm O I sorted by time since partial eclipse ingress. Solid lines connect the time series of observations from a single night for detected emission lines (panels (a) to (c)). Larger detectability thresholds result from Europa’s angular proximity to Jupiter: when Europa is close to Jupiter’s limb, the scattered light is significantly larger, which affects the fidelity of the background subtraction, resulting in larger upper limits (and uncertainties for detected lines) at either the beginning or end of a single night of observations. Perceptually uniform colors and symbols (circles, diamonds, and squares) differentiate separate observing nights to allow the reader to evaluate the goodness of fit on a night-to-night basis, detailed in the legend in the upper right corner. (This legend also applies to Figures 6, 7, 8, 9, and 10.). The data behind this figure are available in machine-readable format. Figure 6 can also be created from the this data file.
(The data used to create this figure are available in the online article.)
(The data used to create this figure are available.)
Other Images in This Article
Copyright and Terms & Conditions
© 2026. The Author(s). Published by the American Astronomical Society.