Image Details
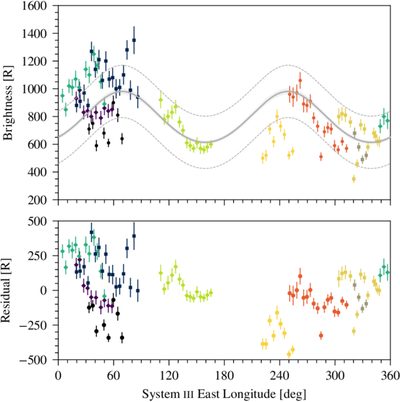
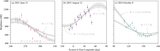
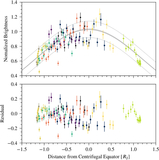
Caption: Figure 8.
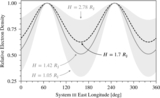
Fit of the nominal ambient electron density (Figure 5) to Europa’s 630.0 nm [O I] brightnesses assuming equal covariance between electron density and emission brightness (Equation (2)). The solid gray line shows the best fit, the shaded gray region shows the uncertainty in the fit, and the dashed gray lines show the standard deviation of the observations relative to the best fit. Perceptually uniform colors and symbols (circles, diamonds, and squares) differentiate separate observing nights to allow the reader to evaluate the goodness of fit on a night-to-night basis (see the legend in Figure 2).
Other Images in This Article
Copyright and Terms & Conditions
© 2026. The Author(s). Published by the American Astronomical Society.
Copyright ©
2026 Astronomy Image Explorer. All Rights Reserved.