Image Details
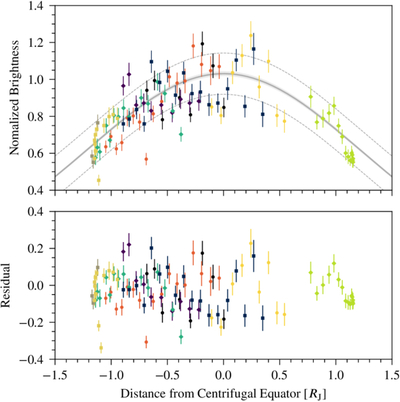
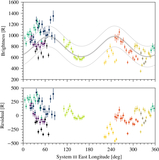
Caption: Figure 10.
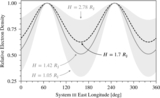
Correlation between Europa’s normalized 630.0 nm [O I] brightness and distance from the plasma sheet centrifugal equator for an electron scale height of 1.7 RJ (F. Bagenal & P. A. Delamere 2011). See Section 4.4 for a description of the normalization process. Negative distances occur when Europa is “below” the centrifugal equator, with “up” defined toward north. The solid gray line shows the best fit of Equation (5) to the complete set of normalized brightnesses with the scale height fixed. The shaded gray region shows the uncertainty in the amplitude from the fit, and the dashed gray lines show the standard deviation of the observations relative to the fit (11% at the centrifugal equator). Perceptually uniform colors and symbols (circles, diamonds, and squares) differentiate separate observing nights to allow the reader to evaluate the goodness of fit on a night-to-night basis (see the legend in Figure 2).
Other Images in This Article
Copyright and Terms & Conditions
© 2026. The Author(s). Published by the American Astronomical Society.