Image Details
Caption: Figure 9.
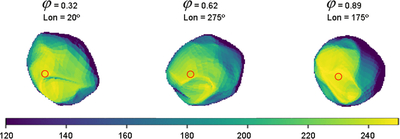
Simulated flux density distribution of Juno at λ = 1.3 mm at three rotational phases. The simulation uses thermal inertia Γ = 10 tiu, equivalent emissivity ﹩\varepsilon ﹩eq = 0.8, index of refraction n = 1.75, and loss tangent ﹩\tan {\rm{\Delta }}﹩ = 0.32. The color bar is in units of Jy arcsec−2. The rotational phase follows the definition in ALMA Partnership et al. (2015). The red circle in each frame marks the location of subsolar point. All frames have sky north in the up direction and east to the left. The relative shift between the subsolar point and the area with the highest temperature displays a complex correspondence. The associated animation shows the flux density distribution during the rotation of Juno with a longitudinal sampling of 5°. The real-time duration is 18 s.
(An animation of this figure is available in the online article.)
(An animation of this figure is available.)
The video/animation of this figure is available in the online journal.
Other Images in This Article
Copyright and Terms & Conditions
© 2026. The Author(s). Published by the American Astronomical Society.