Image Details
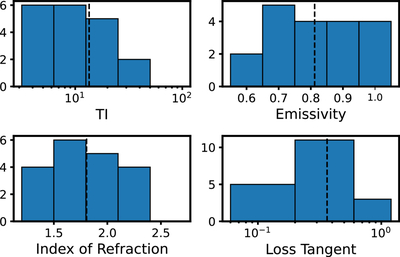
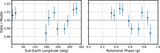
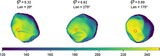
Caption: Figure 3.
The distributions of all 19 best-fit parameters for Juno that are statistically acceptable and indistinguishable in terms of the goodness of fit to the data. The dashed vertical lines mark the averages. TI in the top-left panel represents thermal inertia.
Other Images in This Article
Copyright and Terms & Conditions
© 2026. The Author(s). Published by the American Astronomical Society.
Copyright ©
2026 Astronomy Image Explorer. All Rights Reserved.