Image Details
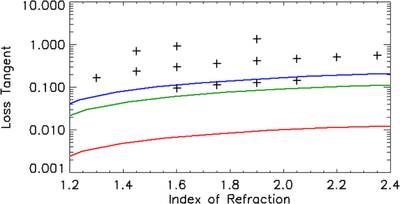
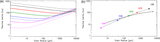
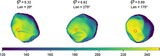
Caption: Figure 7.
Derived loss tangent for Juno (symbols) compared to the values predicted by models (curves) with L5 OC material properties. The red curve is based on A. Brin et al. (2022), the green curve is from the A. Brin et al. (2022) model using the average dielectric values from J. B. Garvin et al. (1988), and the blue curve is from the A. Brin et al. (2022) model using J. B. Garvin et al. (1988), assuming the minimal range for the real component and the maximum range for the imaginary component. The fitted loss tangent is high compared to the model predictions.
Other Images in This Article
Copyright and Terms & Conditions
© 2026. The Author(s). Published by the American Astronomical Society.
Copyright ©
2026 Astronomy Image Explorer. All Rights Reserved.