Image Details
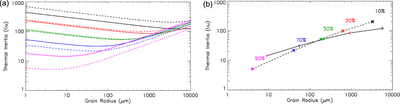
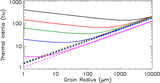
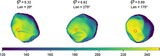
Caption: Figure 4.
Modeled thermal inertia with respect to grain size for S-type asteroid materials. Panel (a) shows the dependence, and panel (b) shows the minimum possible thermal inertia for given porosities as marked in the plot. The curves of different colors from top to bottom represent different porosities: black 10%, red 30%, green 50%, blue 70%, and magenta 90%. The solid curves are based on B. Gundlach & J. Blum (2013), and the dashed curves are based on N. Sakatani et al. (2017).
Other Images in This Article
Copyright and Terms & Conditions
© 2026. The Author(s). Published by the American Astronomical Society.
Copyright ©
2026 Astronomy Image Explorer. All Rights Reserved.