Image Details
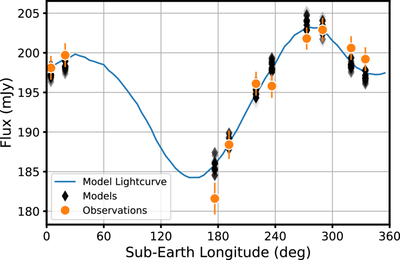
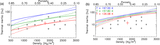
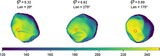
Caption: Figure 2.
Best-fit model to the observed λ = 1.3 mm flux of Juno. The orange circles with error bars are the observed flux densities (ALMA Partnership et al. 2015). The black diamonds of various shades are the top 19 best-fit models that are statistically indistinguishable, with darker symbols representing better fit. The solid curve is the lightcurve corresponding to the best-fit model. The best-fit ﹩{\chi }_{\mathrm{red}}^{2}﹩ = 2.0, and the corresponding RMS is 1.9 mJy, ∼1.0% of the average observed fluxes, Favg.
Other Images in This Article
Copyright and Terms & Conditions
© 2026. The Author(s). Published by the American Astronomical Society.
Copyright ©
2026 Astronomy Image Explorer. All Rights Reserved.