Image Details
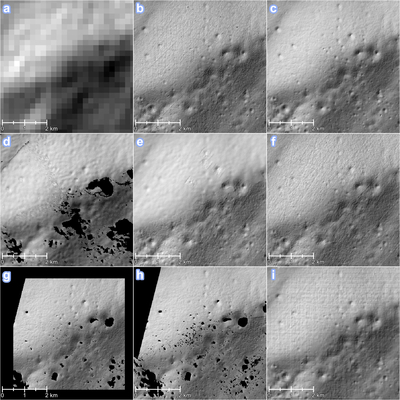
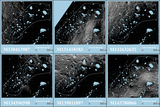
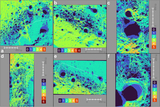
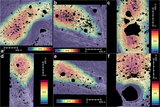
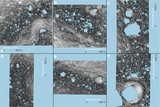
Caption: Figure 2.
Comparison of SP DTMs in the vicinity of CR1. Each dataset is presented as a shaded-relief image in a south polar stereographic projection with an illumination altitude of 30° and an azimuth of 315° clockwise from north. The DTMs shown are as follows. (a) LALT DTM (ID: LALT_GT_SP_NUM; regridded at ~236.90 × 236.90 m). (b) LDEM (ID: LDEM_875S_5M_FLOAT; we used this product as a vertical source of controlled DTMs as described later). (c) One of SPLDEM2021 (ID: Site01_final_adj_5mpp_surf). (d) DTM TC ORTHO (each product shows NoData holes from per-scene coverage and shadow masking), four overlapping DTMs without manual georeferencing (see Table 2 for IDs of CR1; we used this product as a vertical source of controlled DTMs as described later). (e) DEM TC ORTHO (each of them is a composite product that gap-fills across scenes but can introduce horizontal/vertical offsets at joins), ID: DTMTCOw01_00570S897E1937PS. (f) SLDEM2013, 41 DTMs (products with IDs between DTM_MAP_01_S89E200S90E201SC and DTM_MAP_01_S89E240S90E241SC in sequential order). (g) LROC DTM produced by the ESA lander mission (ID: NAC_DTM_ESALL_CR1). (h) LROC DTM produced by the USGS (ID: MOON_LRO_NAC_DEM_89S210E_4mp). (i) CE2 CCD stereo global DEM (ID: CE2_GRAS_DEM_20m_N001_87S000W_A). DTMs around the CR1 region that contain many NoData pixels, have insufficient spatial resolutions, or are publicly inaccessible are not included.
Other Images in This Article
Show More
Copyright and Terms & Conditions
© 2025. The Author(s). Published by the American Astronomical Society.