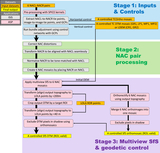
Image Details
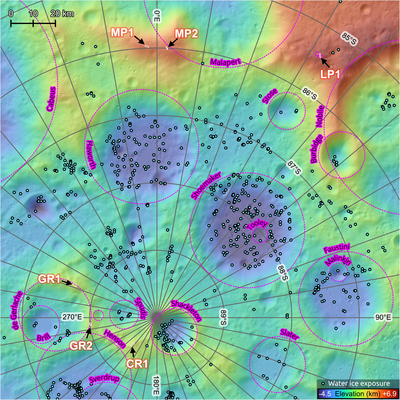
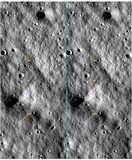
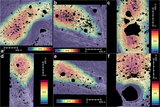
Caption: Figure 1.
Target ROIs (white polygons) pointed to by arrows with the site names of D. De Rosa et al. (2012). Pink dotted circles with labels represent named craters listed in the IAU nomenclature. Light blue dots show the distribution of the purported exposed water ice (S. Li et al. 2018b). The colorized shaded map is based on the LOLA DTM, gridded at 40 m resolution in south polar stereographic projection.
Other Images in This Article
Show More
Copyright and Terms & Conditions
© 2025. The Author(s). Published by the American Astronomical Society.
Copyright ©
2026 Astronomy Image Explorer. All Rights Reserved.