Image Details
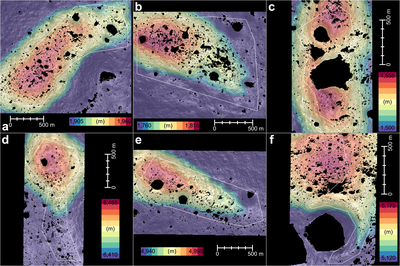
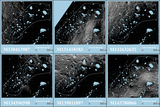
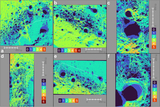
Caption: Figure 9.
SfS DTMs gridded with 1 m pixel−1. They are color-coded by their elevations (50% opacity) overlaid on their own shaded reliefs. (a) CR1, (b) GR1, (c) GR2, (d) LP1, (e) MP1, (f) MP2. The spatial extent of each panel is the same as that in Figure 3. The relative height with a range of 55 m is coded with 11 colors, so that each color represents an interval of 5 m in height. Individual color bars of elevation values include both upper and lower limits, which were used to stretch the colors in each map, and are exactly the same as those of the LDEMs in Figure 3 for comparison. NoData pixels are not rendered, allowing the black backgrounds to remain visible. White closed polylines show our specified areas that are suitable for future landing/roving activities. The shaded-relief base map of each DTM is visually enhanced with 10× vertical exaggeration and light illumination from above each DTM.
Other Images in This Article
Show More
Copyright and Terms & Conditions
© 2025. The Author(s). Published by the American Astronomical Society.