Image Details
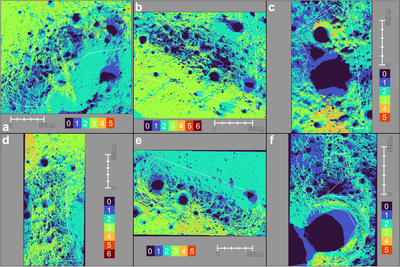
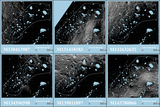
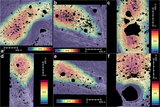
Caption: Figure 8.
The total population of valid overlapping pixels among individual orthoimages. (a) CR1, (b) GR1, (c) GR2, (d) LP1, (e) MP1, (f) MP2. Each of the orthomosaics in Figure 10 was produced from these orthoimage pixels. The spatial extents and white polygons are the same as those in Figure 9. NoData pixels of DTMs in Figure 9 (orthoimage pixel values ≤0.004) are counted as zero.
Other Images in This Article
Show More
Copyright and Terms & Conditions
© 2025. The Author(s). Published by the American Astronomical Society.
Copyright ©
2026 Astronomy Image Explorer. All Rights Reserved.