Image Details
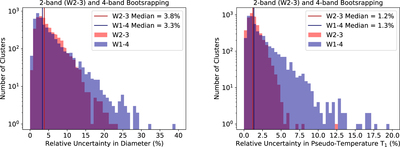
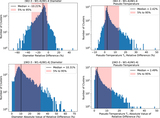
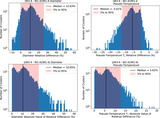
Caption: Figure 5.
Histograms of D and T 1 parameter relative uncertainty, i.e., the standard deviation in accepted bootstrap trials for an object divided by the median value of the bootstrap trials. The median of the relative uncertainties for all objects is shown as a vertical line. Two-band results are shown in red whereas four-band results are shown in blue. Left: relative uncertainty in diameter. Right: relative uncertainty in pseudo-temperature T 1.
Other Images in This Article
Show More
Copyright and Terms & Conditions
© 2023. The Author(s). Published by the American Astronomical Society.
Copyright ©
2026 Astronomy Image Explorer. All Rights Reserved.