Image Details
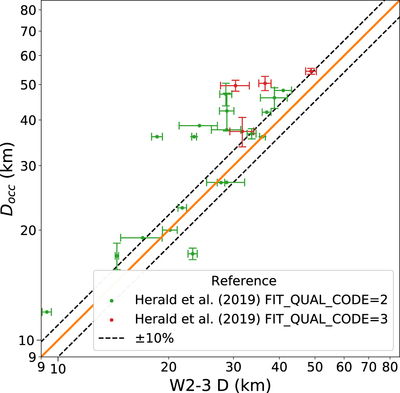
Caption: Figure 7.
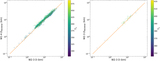
Plot of occultation diameters vs. our corresponding two-band (W2–3) modeled diameters. The orange line represents a perfect one-to-one ratio between diameters whereas the black dotted lines represent a 10% error in the positive and negative directions.
Other Images in This Article
Show More
Copyright and Terms & Conditions
© 2023. The Author(s). Published by the American Astronomical Society.
Copyright ©
2026 Astronomy Image Explorer. All Rights Reserved.