Image Details
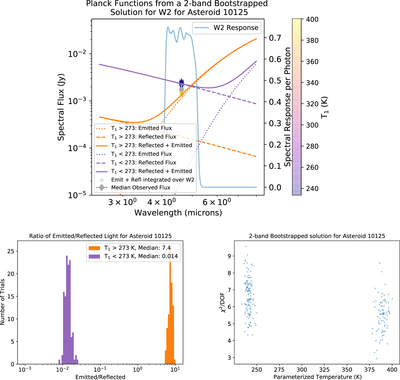
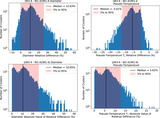
Caption: Figure 2.
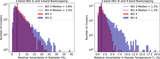
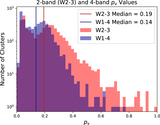
Observed dichotomy in pseudo-temperature solutions for two-band fits illustrated with results from 200 bootstrap trials for asteroid 10125. Top: Planck spectral distributions of emitted light (dotted lines) and reflected light (dashed lines) calculated with the median pseudo-temperature T 1 and median diameter D obtained from the bootstrap trials. The orange curves correspond to the median of 80 trials with high pseudo-temperatures and the purple curves correspond to the median of 120 trials with low pseudo-temperatures. Note how two dissimilar pseudo-temperatures yield a similar total flux (solid lines) within the W2 band, while also yielding similar W3 fluxes. Colored symbols indicate the total (emitted + reflected) spectral flux integrated over the W2 bandpass for each of the 200 trials. The W2 bandpass is shown in a light blue solid line as the spectral response per photon (Wright et al. 2010). The gray circle represents the true median measured W2 flux of the object adjusted to a phase angle of 0, with the error bar given by the standard deviation of the phase-adjusted W2 fluxes. Lower left: histogram of emitted to reflected light (integrated over the W2 bandpass) for 200 bootstrapped trials. High pseudo-temperature solutions are shown in orange whereas low pseudo-temperature solutions are shown in purple. Lower right: reduced chi-squared vs. pseudo-temperature T 1, showing similar values in the two temperature regimes.
Other Images in This Article
Show More
Copyright and Terms & Conditions
© 2023. The Author(s). Published by the American Astronomical Society.